Electrify Chicago
According to the
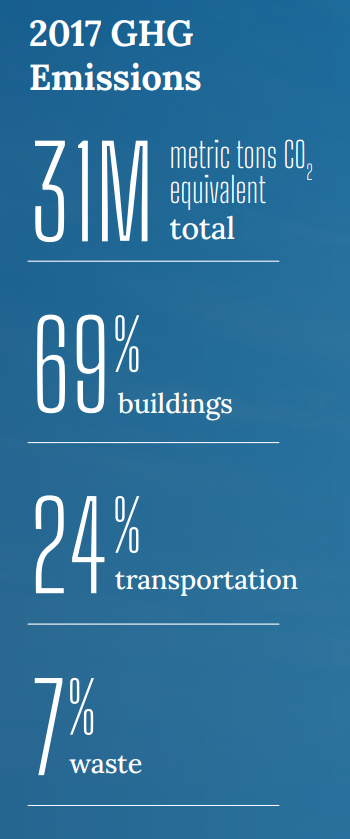
2022 Chicago Climate Action Plan ,
a whopping 69% of Chicago's emissions come from buildings, making it
our biggest challenge and our biggest opportunity as a city to tackle
change. At Electrify Chicago we want to showcase some of the best and worst performing
buildings in the city using publicly available data and manual annotations to add
building photographs and label multi-building owners like universities.
,
a whopping 69% of Chicago's emissions come from buildings, making it
our biggest challenge and our biggest opportunity as a city to tackle
change. At Electrify Chicago we want to showcase some of the best and worst performing
buildings in the city using publicly available data and manual annotations to add
building photographs and label multi-building owners like universities.
You can start by looking at Chicago's buildings with the highest greenhouse gas intensity - this means that they use the most energy when adjusted per unit of square foot, so big buildings could actually perform much better than very inefficient small buildings on this metric.
Chicago Buildings by Greenhouse Gas Intensity
Note: Data only includes large Chicago buildings from 2020
Note: This data only includes buildings whose emissions are reported
under the
Chicago Energy Benchmarking Ordinance. According to the City “As of 2016,
this list includes all commercial, institutional, and residential buildings larger than
50,000 square feet.” This dataset is also then filtered to only buildings with
reported emissions > 1,000 metric tons CO2 equivalent.
This data is also from 2020, but when new benchmark data is available, we'll update the site.
| Property Name / address | Primary Property Type |
Greenhouse Gas Intensity (kg CO2 eq./sqft) |
Total Greenhouse Emissions (metric tons CO2 eq.) |
|---|---|---|---|
|
Hyde Park Academy HS -CPS
6220 S Stony Island Ave
| K-12 School | 6.5 kg/sqft
Lowest 29%
| 2,112 tons
Highest 48%
|
|
Kinzie Station
330 N Jefferson Ct
| Multifamily Housing | 6.5 kg/sqft
Lowest 29%
| 1,468 tons
Lowest 28%
|
|
One Museum Park South
1901 S Calumet Ave
| Multifamily Housing | 6.5 kg/sqft
Lowest 29%
| 2,716 tons
Highest 34%
|
|
Lowell House
88 W Schiller St
| Multifamily Housing | 6.5 kg/sqft
Lowest 29%
| 1,806 tons
Lowest 42%
|
|
The New York Private Residences
3660 N Lake Shore Dr
| Multifamily Housing | 6.5 kg/sqft
Lowest 29%
| 4,037 tons
Highest 21%
|
|
2020 Lincoln Park West Condominium Association
2020 N Lincoln Park West
| Multifamily Housing | 6.5 kg/sqft
Lowest 29%
| 2,810 tons
Highest 33%
|
|
1251 S. Michigan Avenue
1251 S. Michigan Avenue
| Multifamily Housing | 6.5 kg/sqft
Lowest 29%
| 4,028 tons
Highest 21%
|
|
Harbor Point
155 N Harbor Dr
| Multifamily Housing | 6.5 kg/sqft
Lowest 29%
| 7,760 tons
Highest 9%
|
|
Park Tower Condominium Association
5415 N Sheridan Rd
| Multifamily Housing | 6.5 kg/sqft
Lowest 29%
| 5,611 tons
Highest 13%
|
|
Aon Center
🚩
200 E Randolph St
| Office | 6.5 kg/sqft
Lowest 29%
| 20,741 tons #22 Highest
|
|
Imperial Towers Condominium
🚩
4250 N Marine Dr
| Multifamily Housing | 6.5 kg/sqft
Lowest 29%
| 7,274 tons
Highest 9%
|
|
Hyatt Regency Chicago
🚩
151 E Wacker Dr
| Hotel | 6.5 kg/sqft
Lowest 29%
| 13,219 tons #49 Highest
|
|
Malibu East Condominium
6033 N Sheridan Rd
| Multifamily Housing | 6.4 kg/sqft
Lowest 27%
| 6,357 tons
Highest 11%
|
|
One South Dearborn
1 S Dearborn
| Office | 6.4 kg/sqft
Lowest 27%
| 6,042 tons
Highest 12%
|
|
525 W Monroe St
525 W Monroe St
| Office | 6.4 kg/sqft
Lowest 27%
| 6,534 tons
Highest 11%
|
Data Source:
Chicago Energy Benchmarking Data