Electrify Chicago
According to the
2022 Chicago Climate Action Plan ,
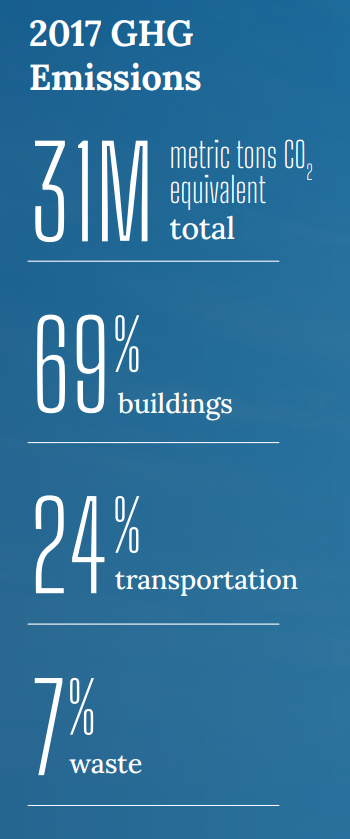
a whopping 69% of Chicago's emissions come from buildings, making it
our biggest challenge and our biggest opportunity as a city to tackle
change. At Electrify Chicago we want to showcase some of the best and worst performing
buildings in the city using publicly available data and manual annotations to add
building photographs and label multi-building owners like universities.
,
a whopping 69% of Chicago's emissions come from buildings, making it
our biggest challenge and our biggest opportunity as a city to tackle
change. At Electrify Chicago we want to showcase some of the best and worst performing
buildings in the city using publicly available data and manual annotations to add
building photographs and label multi-building owners like universities.
You can start by looking at Chicago's buildings with the highest greenhouse gas intensity - this means that they use the most energy when adjusted per unit of square foot, so big buildings could actually perform much better than very inefficient small buildings on this metric.
Chicago Buildings by Greenhouse Gas Intensity
Note: Data only includes large Chicago buildings from 2020
Note: This data only includes buildings whose emissions are reported
under the
Chicago Energy Benchmarking Ordinance. According to the City “As of 2016,
this list includes all commercial, institutional, and residential buildings larger than
50,000 square feet.” This dataset is also then filtered to only buildings with
reported emissions > 1,000 metric tons CO2 equivalent.
This data is also from 2020, but when new benchmark data is available, we'll update the site.
| Property Name / address | Primary Property Type |
Greenhouse Gas Intensity (kg CO2 eq./sqft) |
Total Greenhouse Emissions (metric tons CO2 eq.) |
|---|---|---|---|
|
150 N Michigan Ave
🏆
150 N Michigan Ave
| Office | 6.5 kg/sqft
Lowest 29%
| 4,598 tons
Highest 18%
|
|
Three First National Plaza
70 W Madison St
| Office | 6.5 kg/sqft
Lowest 29%
| 10,364 tons
Highest 6%
|
|
150 N RIVERSIDE PLAZA
150 N RIVERSIDE PLAZA
| Office | 6.5 kg/sqft
Lowest 29%
| 9,684 tons
Highest 7%
|
|
1212 Lake Shore Drive Condominium
1212 N Lake Shore Dr
| Multifamily Housing | 6.5 kg/sqft
Lowest 29%
| 2,464 tons
Highest 39%
|
|
5999-Westin Chicago River North
320 N Dearborn Ave
| Hotel | 6.5 kg/sqft
Lowest 29%
| 2,866 tons
Highest 32%
|
|
1400 Lake Shore Drive Condominium Association
1400 N Lake Shore Dr
| Multifamily Housing | 6.5 kg/sqft
Lowest 29%
| 2,125 tons
Highest 47%
|
|
North Park Village Apartments - Building H
5801 N Pulaski Rd - Bldg H
| Residential Care Facility | 6.5 kg/sqft
Lowest 29%
| 1,788 tons
Lowest 42%
|
|
MiCA
2733 W BELDEN AVE
| Multifamily Housing | 6.5 kg/sqft
Lowest 29%
| 1,325 tons
Lowest 20%
|
|
110 W SUPERIOR ST
🏆
110 W SUPERIOR ST
| Multifamily Housing | 6.5 kg/sqft
Lowest 29%
| 1,016 tons
#15 Lowest
|
|
Lakeside on the Park Condominium
1250 S INDIANA AVE
| Multifamily Housing | 6.5 kg/sqft
Lowest 29%
| 1,344 tons
Lowest 22%
|
|
University Station CA
1550 S Blue Island Ave
| Multifamily Housing | 6.5 kg/sqft
Lowest 29%
| 1,947 tons
Lowest 47%
|
|
Sheridan Point Condominium Association
🏆
6325 N SHERIDAN RD
| Multifamily Housing | 6.5 kg/sqft
Lowest 29%
| 1,008 tons
#6 Lowest
|
|
1122 N DEARBORN ST
1122 N DEARBORN ST
| Multifamily Housing | 6.5 kg/sqft
Lowest 29%
| 1,522 tons
Lowest 31%
|
|
2850 N SHERIDAN RD
2850 N SHERIDAN RD
| Multifamily Housing | 6.5 kg/sqft
Lowest 29%
| 1,219 tons
Lowest 16%
|
|
The Pinnacle
21 E Huron St
| Multifamily Housing | 6.5 kg/sqft
Lowest 29%
| 3,970 tons
Highest 22%
|
Data Source:
Chicago Energy Benchmarking Data