Electrify Chicago
According to the
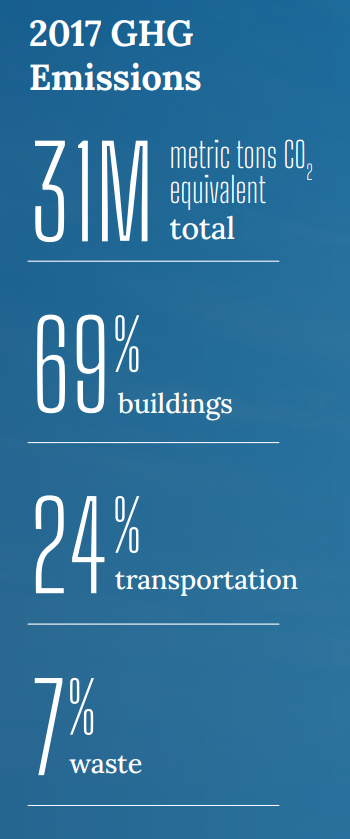
2022 Chicago Climate Action Plan ,
a whopping 69% of Chicago's emissions come from buildings, making it
our biggest challenge and our biggest opportunity as a city to tackle
change. At Electrify Chicago we want to showcase some of the best and worst performing
buildings in the city using publicly available data and manual annotations to add
building photographs and label multi-building owners like universities.
,
a whopping 69% of Chicago's emissions come from buildings, making it
our biggest challenge and our biggest opportunity as a city to tackle
change. At Electrify Chicago we want to showcase some of the best and worst performing
buildings in the city using publicly available data and manual annotations to add
building photographs and label multi-building owners like universities.
You can start by looking at Chicago's buildings with the highest greenhouse gas intensity - this means that they use the most energy when adjusted per unit of square foot, so big buildings could actually perform much better than very inefficient small buildings on this metric.
Chicago Buildings by Greenhouse Gas Intensity
Note: Data only includes large Chicago buildings from 2020
Note: This data only includes buildings whose emissions are reported
under the
Chicago Energy Benchmarking Ordinance. According to the City “As of 2016,
this list includes all commercial, institutional, and residential buildings larger than
50,000 square feet.” This dataset is also then filtered to only buildings with
reported emissions > 1,000 metric tons CO2 equivalent.
This data is also from 2020, but when new benchmark data is available, we'll update the site.
| Property Name / address | Primary Property Type |
Greenhouse Gas Intensity (kg CO2 eq./sqft) |
Total Greenhouse Emissions (metric tons CO2 eq.) |
|---|---|---|---|
|
1150 Condominium Association
1150 N Lake Shore Dr
| Multifamily Housing | 6.7 kg/sqft
Lowest 33%
| 1,607 tons
Lowest 34%
|
|
Central Standard Building
231 S LaSalle St
| Office | 6.7 kg/sqft
Lowest 33%
| 7,877 tons
Highest 8%
|
|
Marquee at Block 37
25 West Randolph Street
| Multifamily Housing | 6.7 kg/sqft
Lowest 33%
| 3,957 tons
Highest 22%
|
|
One North State
1 N State St
| Office | 6.7 kg/sqft
Lowest 33%
| 5,527 tons
Highest 13%
|
|
757 Orleans at Chicago Condominium
757 N Orleans St
| Multifamily Housing | 6.7 kg/sqft
Lowest 33%
| 2,121 tons
Highest 48%
|
|
Armour Square Apartments
3120 3250 S Wentworth Ave
| Multifamily Housing | 6.7 kg/sqft
Lowest 33%
| 2,104 tons
Highest 48%
|
|
The Streeter
345 E Ohio St
| Multifamily Housing | 6.7 kg/sqft
Lowest 33%
| 5,284 tons
Highest 14%
|
|
4343 Clarendon Condominium Association
4343 N Clarendon Ave
| Multifamily Housing | 6.7 kg/sqft
Lowest 33%
| 2,824 tons
Highest 33%
|
|
Leo Burnett Building
35 W Wacker Dr
| Office | 6.6 kg/sqft
Lowest 31%
| 9,225 tons
Highest 7%
|
|
100 E Walton CA
100 E Walton St
| Multifamily Housing | 6.6 kg/sqft
Lowest 31%
| 2,146 tons
Highest 47%
|
|
190 N State St
190 N State St
| Office | 6.6 kg/sqft
Lowest 31%
| 1,507 tons
Lowest 30%
|
|
Mayfair
189 E Lake Shore Dr
| Multifamily Housing | 6.6 kg/sqft
Lowest 31%
| 1,129 tons
Lowest 9%
|
|
Spoke Apartments
728 N Morgan St
| Multifamily Housing | 6.6 kg/sqft
Lowest 31%
| 2,307 tons
Highest 43%
|
|
Century Tower
182 W Lake St
| Multifamily Housing | 6.6 kg/sqft
Lowest 31%
| 1,683 tons
Lowest 37%
|
|
Zelda Ormes Senior Apartments
116 W Elm St
| Multifamily Housing | 6.6 kg/sqft
Lowest 31%
| 1,046 tons
Lowest 4%
|
Data Source:
Chicago Energy Benchmarking Data