Electrify Chicago
According to the
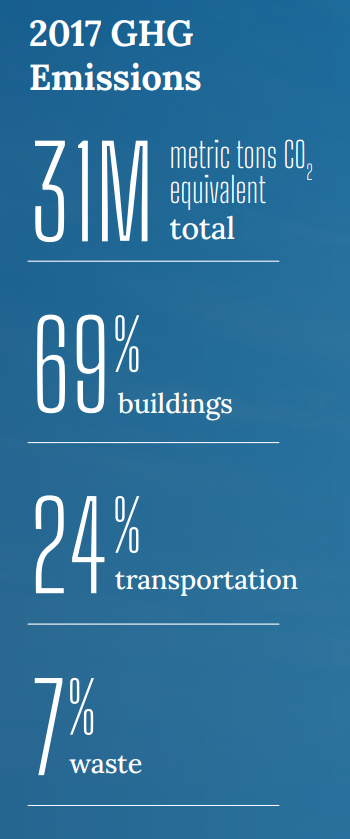
2022 Chicago Climate Action Plan ,
a whopping 69% of Chicago's emissions come from buildings, making it
our biggest challenge and our biggest opportunity as a city to tackle
change. At Electrify Chicago we want to showcase some of the best and worst performing
buildings in the city using publicly available data and manual annotations to add
building photographs and label multi-building owners like universities.
,
a whopping 69% of Chicago's emissions come from buildings, making it
our biggest challenge and our biggest opportunity as a city to tackle
change. At Electrify Chicago we want to showcase some of the best and worst performing
buildings in the city using publicly available data and manual annotations to add
building photographs and label multi-building owners like universities.
You can start by looking at Chicago's buildings with the highest greenhouse gas intensity - this means that they use the most energy when adjusted per unit of square foot, so big buildings could actually perform much better than very inefficient small buildings on this metric.
Chicago Buildings by Greenhouse Gas Intensity
Note: Data only includes large Chicago buildings from 2020
Note: This data only includes buildings whose emissions are reported
under the
Chicago Energy Benchmarking Ordinance. According to the City “As of 2016,
this list includes all commercial, institutional, and residential buildings larger than
50,000 square feet.” This dataset is also then filtered to only buildings with
reported emissions > 1,000 metric tons CO2 equivalent.
This data is also from 2020, but when new benchmark data is available, we'll update the site.
| Property Name / address | Primary Property Type |
Greenhouse Gas Intensity (kg CO2 eq./sqft) |
Total Greenhouse Emissions (metric tons CO2 eq.) |
|---|---|---|---|
|
Dwight Lofts LLC
642 S Clark St
| Multifamily Housing | 8.4 kg/sqft
Highest 41%
| 1,656 tons
Lowest 36%
|
|
990 North Lake Shore Drive
990 N Lake Shore Dr
| Multifamily Housing | 8.4 kg/sqft
Highest 41%
| 2,502 tons
Highest 38%
|
|
21 E CHESTNUT ST
🏆
21 E CHESTNUT ST
| Multifamily Housing | 8.4 kg/sqft
Highest 41%
| 1,028 tons
#30 Lowest
|
|
1035 W Van Buren St
1035 W Van Buren St
| Multifamily Housing | 8.4 kg/sqft
Highest 41%
| 2,117 tons
Highest 48%
|
|
Vision On State Condominium Association
1255 S State St
| Multifamily Housing | 8.4 kg/sqft
Highest 41%
| 2,318 tons
Highest 43%
|
|
Admiral's Pointe Condominium Association
645 N Kingsbury St
| Multifamily Housing | 8.4 kg/sqft
Highest 41%
| 1,786 tons
Lowest 42%
|
|
Ambassador House Condominium Association
1317 1325 N STATE PKWY
| Multifamily Housing | 8.3 kg/sqft
Highest 42%
| 1,589 tons
Lowest 34%
|
|
Kenect Chicago
505 N GREEN ST
| Multifamily Housing | 8.3 kg/sqft
Highest 42%
| 1,523 tons
Lowest 31%
|
|
Curie Metropolitan HS -CPS
4975 S Archer Ave
| K-12 School | 8.3 kg/sqft
Highest 42%
| 3,464 tons
Highest 25%
|
|
The Fordham Condominium Association
25 E Superior St
| Multifamily Housing | 8.3 kg/sqft
Highest 42%
| 4,825 tons
Highest 17%
|
|
21 W. Chestnut Condominium Association
21 W Chestnut St
| Multifamily Housing | 8.3 kg/sqft
Highest 42%
| 1,412 tons
Lowest 24%
|
|
2728 N HAMPDEN CT
2728 N HAMPDEN CT
| Multifamily Housing | 8.3 kg/sqft
Highest 42%
| 1,160 tons
Lowest 12%
|
|
Trump International Hotel & Tower Chicago
🚩
401 N Wabash Ave
| Mixed Use Property | 8.3 kg/sqft
Highest 42%
| 17,566 tons #33 Highest
|
|
Hilton Chicago MM Suites
198 E Delaware Pl
| Hotel | 8.3 kg/sqft
Highest 42%
| 2,625 tons
Highest 36%
|
|
Intercontinental Hotel
505 N Michigan Ave
| Hotel | 8.3 kg/sqft
Highest 42%
| 5,905 tons
Highest 12%
|
Data Source:
Chicago Energy Benchmarking Data