Electrify Chicago
According to the
2022 Chicago Climate Action Plan ,
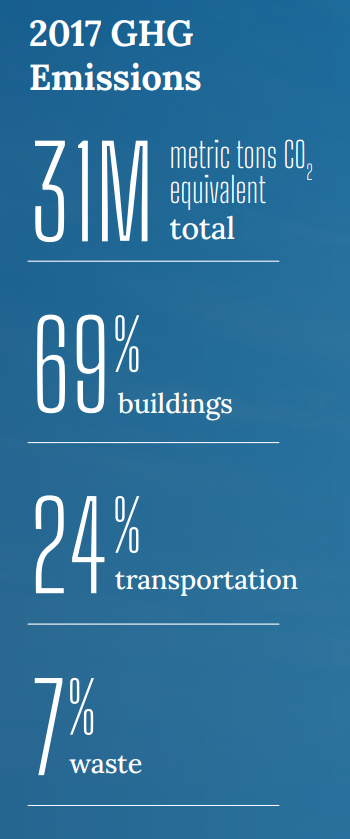
a whopping 69% of Chicago's emissions come from buildings, making it
our biggest challenge and our biggest opportunity as a city to tackle
change. At Electrify Chicago we want to showcase some of the best and worst performing
buildings in the city using publicly available data and manual annotations to add
building photographs and label multi-building owners like universities.
,
a whopping 69% of Chicago's emissions come from buildings, making it
our biggest challenge and our biggest opportunity as a city to tackle
change. At Electrify Chicago we want to showcase some of the best and worst performing
buildings in the city using publicly available data and manual annotations to add
building photographs and label multi-building owners like universities.
You can start by looking at Chicago's buildings with the highest greenhouse gas intensity - this means that they use the most energy when adjusted per unit of square foot, so big buildings could actually perform much better than very inefficient small buildings on this metric.
Chicago Buildings by Greenhouse Gas Intensity
Note: Data only includes large Chicago buildings from 2020
Note: This data only includes buildings whose emissions are reported
under the
Chicago Energy Benchmarking Ordinance. According to the City “As of 2016,
this list includes all commercial, institutional, and residential buildings larger than
50,000 square feet.” This dataset is also then filtered to only buildings with
reported emissions > 1,000 metric tons CO2 equivalent.
This data is also from 2020, but when new benchmark data is available, we'll update the site.
| Property Name / address | Primary Property Type |
Greenhouse Gas Intensity (kg CO2 eq./sqft) |
Total Greenhouse Emissions (metric tons CO2 eq.) |
|---|---|---|---|
|
Malcolm X College & School of Health Sciences
1900 W JACKSON BLVD
| College/University | 8.8 kg/sqft
Highest 37%
| 4,774 tons
Highest 17%
|
|
Bel Harbour Condominium Association
420 W BELMONT AVE
| Multifamily Housing | 8.8 kg/sqft
Highest 37%
| 1,905 tons
Lowest 45%
|
|
Winston Towers II
6833 N Kedzie Ave
| Multifamily Housing | 8.8 kg/sqft
Highest 37%
| 2,304 tons
Highest 43%
|
|
The Residences at Joffrey Tower Condo Association
8 E Randolph St
| Multifamily Housing | 8.8 kg/sqft
Highest 37%
| 3,609 tons
Highest 24%
|
|
Willis Tower
🚨
📷
233 S Wacker Dr
| Office | 8.8 kg/sqft
Highest 37%
| 43,675 tons #8 Highest
|
|
111 E Wacker Dr
111 E Wacker Dr
| Office | 8.8 kg/sqft
Highest 37%
| 9,984 tons
Highest 6%
|
|
The Silversmith Hotel & Suites
10 S Wabash Ave
| Hotel | 8.7 kg/sqft
Highest 38%
| 1,178 tons
Lowest 13%
|
|
Fullerton Plaza
1737 - 1829 W Fullerton Ave
| Retail Store | 8.7 kg/sqft
Highest 38%
| 1,066 tons
Lowest 5%
|
|
Gateway West Loop Apartments
11 S Green St
| Multifamily Housing | 8.7 kg/sqft
Highest 38%
| 1,159 tons
Lowest 12%
|
|
W Chicago Lakeshore
644 N Lakeshore Dr
| Hotel | 8.7 kg/sqft
Highest 38%
| 3,333 tons
Highest 27%
|
|
550 St. Clair Condominiums
550 N St Clair St
| Multifamily Housing | 8.7 kg/sqft
Highest 38%
| 1,483 tons
Lowest 29%
|
|
Gold Coast Galleria
111 W Maple St
| Mixed Use Property | 8.7 kg/sqft
Highest 38%
| 4,030 tons
Highest 21%
|
|
Kennedy HS / Kinzie ES -CPS
6325 W 56th St
| K-12 School | 8.7 kg/sqft
Highest 38%
| 2,037 tons
Lowest 50%
|
|
United Winthrop Tower Cooperative
4848 N Winthrop Ave
| Multifamily Housing | 8.7 kg/sqft
Highest 38%
| 2,174 tons
Highest 46%
|
|
Eliot House Condominium Association
1255 N Sandburg Ter
| Multifamily Housing | 8.7 kg/sqft
Highest 38%
| 2,733 tons
Highest 34%
|
Data Source:
Chicago Energy Benchmarking Data