Electrify Chicago
According to the
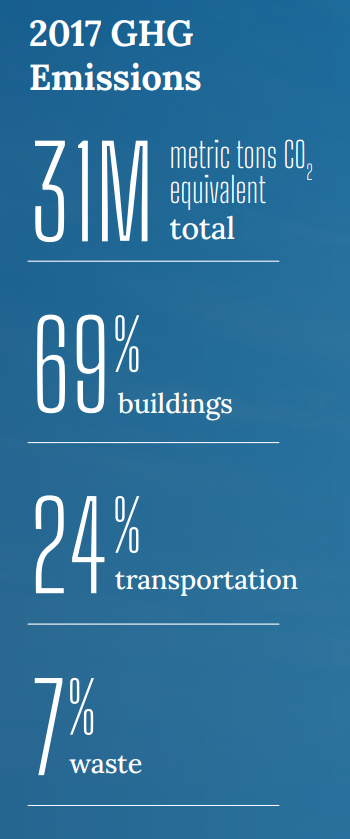
2022 Chicago Climate Action Plan ,
a whopping 69% of Chicago's emissions come from buildings, making it
our biggest challenge and our biggest opportunity as a city to tackle
change. At Electrify Chicago we want to showcase some of the best and worst performing
buildings in the city using publicly available data and manual annotations to add
building photographs and label multi-building owners like universities.
,
a whopping 69% of Chicago's emissions come from buildings, making it
our biggest challenge and our biggest opportunity as a city to tackle
change. At Electrify Chicago we want to showcase some of the best and worst performing
buildings in the city using publicly available data and manual annotations to add
building photographs and label multi-building owners like universities.
You can start by looking at Chicago's buildings with the highest greenhouse gas intensity - this means that they use the most energy when adjusted per unit of square foot, so big buildings could actually perform much better than very inefficient small buildings on this metric.
Chicago Buildings by Greenhouse Gas Intensity
Note: Data only includes large Chicago buildings from 2020
Note: This data only includes buildings whose emissions are reported
under the
Chicago Energy Benchmarking Ordinance. According to the City “As of 2016,
this list includes all commercial, institutional, and residential buildings larger than
50,000 square feet.” This dataset is also then filtered to only buildings with
reported emissions > 1,000 metric tons CO2 equivalent.
This data is also from 2020, but when new benchmark data is available, we'll update the site.
| Property Name / address | Primary Property Type |
Greenhouse Gas Intensity (kg CO2 eq./sqft) |
Total Greenhouse Emissions (metric tons CO2 eq.) |
|---|---|---|---|
|
Dawson Technical Institute
3901 S State St
| College/University | 9.6 kg/sqft
Highest 32%
| 1,426 tons
Lowest 25%
|
|
Target, Chicago Peterson Ave (2079)
2112 W Peterson Ave
| Retail Store | 9.6 kg/sqft
Highest 32%
| 1,542 tons
Lowest 31%
|
|
Headquarters
547 W Jackson Blvd
| Office | 9.6 kg/sqft
Highest 32%
| 3,328 tons
Highest 27%
|
|
Orr Academy HS -CPS
730 N Pulaski Rd
| K-12 School | 9.6 kg/sqft
Highest 32%
| 2,907 tons
Highest 32%
|
|
The Van Buren
808 W Van Buren
| Multifamily Housing | 9.6 kg/sqft
Highest 32%
| 1,133 tons
Lowest 10%
|
|
Carson, Rachel Elementary -CPS
5516 S Maplewood Ave
| K-12 School | 9.6 kg/sqft
Highest 32%
| 1,332 tons
Lowest 21%
|
|
North Grand HS -CPS
4330 W Wabansia Ave
| K-12 School | 9.6 kg/sqft
Highest 32%
| 1,961 tons
Lowest 47%
|
|
The Seneca
200 E Chestnut St
| Multifamily Housing | 9.6 kg/sqft
Highest 32%
| 1,620 tons
Lowest 34%
|
|
Old Town Park
1140 N Wells St
| Multifamily Housing | 9.6 kg/sqft
Highest 32%
| 3,000 tons
Highest 30%
|
|
30 East Huron Condominium Association
30 40 E Huron St
| Multifamily Housing | 9.6 kg/sqft
Highest 32%
| 5,317 tons
Highest 14%
|
|
The Grand Ohio
211 E Ohio St
| Multifamily Housing | 9.6 kg/sqft
Highest 32%
| 5,441 tons
Highest 14%
|
|
600 Fulton Owner, LLC
600 W Fulton St
| Office | 9.5 kg/sqft
Highest 33%
| 2,248 tons
Highest 45%
|
|
Target, Chicago South Pulaski (1879)
4433 S Pulaski Rd
| Retail Store | 9.5 kg/sqft
Highest 33%
| 1,146 tons
Lowest 11%
|
|
Haymarket Center
932 W Washington Blvd
| Residential Care Facility | 9.5 kg/sqft
Highest 33%
| 1,433 tons
Lowest 26%
|
|
Bernard Horwich Building
3003 3033 W TOUHY AVE
| Mixed Use Property | 9.5 kg/sqft
Highest 33%
| 1,572 tons
Lowest 33%
|
Data Source:
Chicago Energy Benchmarking Data