Electrify Chicago
According to the
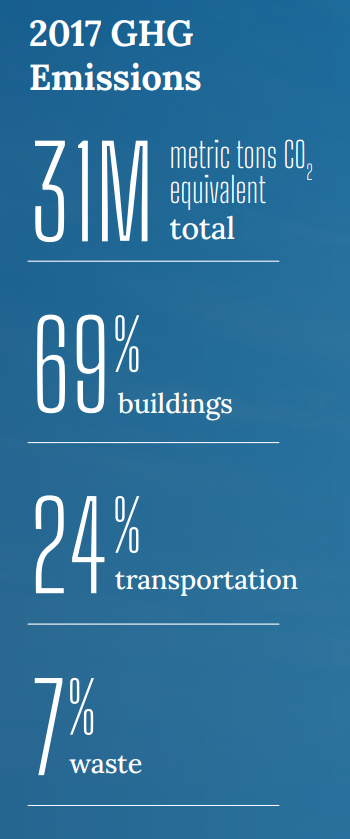
2022 Chicago Climate Action Plan ,
a whopping 69% of Chicago's emissions come from buildings, making it
our biggest challenge and our biggest opportunity as a city to tackle
change. At Electrify Chicago we want to showcase some of the best and worst performing
buildings in the city using publicly available data and manual annotations to add
building photographs and label multi-building owners like universities.
,
a whopping 69% of Chicago's emissions come from buildings, making it
our biggest challenge and our biggest opportunity as a city to tackle
change. At Electrify Chicago we want to showcase some of the best and worst performing
buildings in the city using publicly available data and manual annotations to add
building photographs and label multi-building owners like universities.
You can start by looking at Chicago's buildings with the highest greenhouse gas intensity - this means that they use the most energy when adjusted per unit of square foot, so big buildings could actually perform much better than very inefficient small buildings on this metric.
Chicago Buildings by Greenhouse Gas Intensity
Note: Data only includes large Chicago buildings from 2020
Note: This data only includes buildings whose emissions are reported
under the
Chicago Energy Benchmarking Ordinance. According to the City “As of 2016,
this list includes all commercial, institutional, and residential buildings larger than
50,000 square feet.” This dataset is also then filtered to only buildings with
reported emissions > 1,000 metric tons CO2 equivalent.
This data is also from 2020, but when new benchmark data is available, we'll update the site.
| Property Name / address | Primary Property Type |
Greenhouse Gas Intensity (kg CO2 eq./sqft) |
Total Greenhouse Emissions (metric tons CO2 eq.) |
|---|---|---|---|
|
Navy Pier, Inc.
📷
600 E Grand Ave
| Mixed Use Property | 11.0 kg/sqft
Highest 24%
| 12,638 tons
Highest 4%
|
|
McClurg Court Center
🚩
333 E Ontario St
| Multifamily Housing | 11.0 kg/sqft
Highest 24%
| 9,004 tons
Highest 7%
|
|
Lawndale Gardens
2530 S Washtenaw Ave
| Multifamily Housing | 10.9 kg/sqft
Highest 25%
| 1,088 tons
Lowest 6%
|
|
1819 S Michigan Condominium Association
1819 S MICHIGAN AVE
| Multifamily Housing | 10.9 kg/sqft
Highest 25%
| 1,254 tons
Lowest 17%
|
|
343 S DEARBORN ST
343 S DEARBORN ST
| Multifamily Housing | 10.9 kg/sqft
Highest 25%
| 1,829 tons
Lowest 43%
|
|
770 N Halsted St
770 N Halsted St
| Office | 10.8 kg/sqft
Highest 25%
| 1,584 tons
Lowest 33%
|
|
Catholic Theological Union - Academic and Conferen
5416 S Cornell Ave
| College/University | 10.8 kg/sqft
Highest 25%
| 1,095 tons
Lowest 7%
|
|
Clark Academic Prep HS -CPS
5101 W Harrison St
| K-12 School | 10.8 kg/sqft
Highest 25%
| 1,630 tons
Lowest 35%
|
|
Target, Chicago South Loop (1889)
1154 S Clark St
| Retail Store | 10.8 kg/sqft
Highest 25%
| 1,929 tons
Lowest 46%
|
|
Home Depot Store #8598
6211 N LINCOLN AVE
| Retail Store | 10.8 kg/sqft
Highest 25%
| 1,236 tons
Lowest 16%
|
|
Uptown Bank Building
4753 N Broadway St
| Office | 10.8 kg/sqft
Highest 25%
| 1,092 tons
Lowest 6%
|
|
W CHICAGO - CITY CENTER
172 W Adams St
| Hotel | 10.8 kg/sqft
Highest 25%
| 2,618 tons
Highest 36%
|
|
Trumbull Park Homes
2437 E 106th St
| Multifamily Housing | 10.8 kg/sqft
Highest 25%
| 4,306 tons
Highest 19%
|
|
Ronald McDonald House near Lurie Children's
211 E Grand Ave
| Hotel | 10.7 kg/sqft
Highest 26%
| 1,138 tons
Lowest 10%
|
|
Home Depot, #1986 47th & Western
4555 S Western Blvd
| Retail Store | 10.7 kg/sqft
Highest 26%
| 1,106 tons
Lowest 8%
|
Data Source:
Chicago Energy Benchmarking Data