Electrify Chicago
According to the
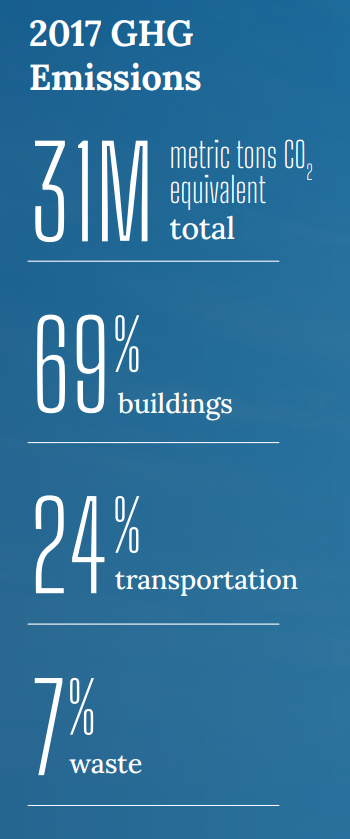
2022 Chicago Climate Action Plan ,
a whopping 69% of Chicago's emissions come from buildings, making it
our biggest challenge and our biggest opportunity as a city to tackle
change. At Electrify Chicago we want to showcase some of the best and worst performing
buildings in the city using publicly available data and manual annotations to add
building photographs and label multi-building owners like universities.
,
a whopping 69% of Chicago's emissions come from buildings, making it
our biggest challenge and our biggest opportunity as a city to tackle
change. At Electrify Chicago we want to showcase some of the best and worst performing
buildings in the city using publicly available data and manual annotations to add
building photographs and label multi-building owners like universities.
You can start by looking at Chicago's buildings with the highest greenhouse gas intensity - this means that they use the most energy when adjusted per unit of square foot, so big buildings could actually perform much better than very inefficient small buildings on this metric.
Chicago Buildings by Greenhouse Gas Intensity
Note: Data only includes large Chicago buildings from 2020
Note: This data only includes buildings whose emissions are reported
under the
Chicago Energy Benchmarking Ordinance. According to the City “As of 2016,
this list includes all commercial, institutional, and residential buildings larger than
50,000 square feet.” This dataset is also then filtered to only buildings with
reported emissions > 1,000 metric tons CO2 equivalent.
This data is also from 2020, but when new benchmark data is available, we'll update the site.
| Property Name / address | Primary Property Type |
Greenhouse Gas Intensity (kg CO2 eq./sqft) |
Total Greenhouse Emissions (metric tons CO2 eq.) |
|---|---|---|---|
|
North Lawndale College Prep Charter, Collins - CPS
1313 S Sacramento Blvd
| K-12 School | 11.7 kg/sqft
Highest 21%
| 2,409 tons
Highest 40%
|
|
6125 S KENWOOD AVE
6125 S KENWOOD AVE
| Senior Living Community | 11.7 kg/sqft
Highest 21%
| 1,504 tons
Lowest 30%
|
|
860 N DEWITT PL
860 N DEWITT PL
| Multifamily Housing | 11.7 kg/sqft
Highest 21%
| 1,455 tons
Lowest 27%
|
|
Burnham Pointe
730 South Clark Street
| Multifamily Housing | 11.7 kg/sqft
Highest 21%
| 5,006 tons
Highest 16%
|
|
Harper Court
5235 S Harper Ct
| Office | 11.6 kg/sqft
Highest 21%
| 2,686 tons
Highest 35%
|
|
Student Center
(DePaul)
2250 N Sheffield Ave
| College/University | 11.6 kg/sqft
Highest 21%
| 1,736 tons
Lowest 40%
|
|
Garland Building
111 N Wabash Ave
| Office | 11.6 kg/sqft
Highest 21%
| 3,016 tons
Highest 30%
|
|
29 E. Madison LLC
29 E Madison St
| Office | 11.6 kg/sqft
Highest 21%
| 2,795 tons
Highest 33%
|
|
401 S Clinton St
401 S Clinton St
| Office | 11.5 kg/sqft
Highest 22%
| 1,878 tons
Lowest 44%
|
|
The Woodlands of Bronzeville Condominium Association
619 645 E WOODLAND PARK
| Multifamily Housing | 11.5 kg/sqft
Highest 22%
| 1,174 tons
Lowest 13%
|
|
223 Jackson Brooks Building LLC
223 W Jackson Blvd
| Office | 11.5 kg/sqft
Highest 22%
| 1,927 tons
Lowest 46%
|
|
Chicago Transit Authority - 120 N. Racine
120 N Racine Ave
| Office | 11.5 kg/sqft
Highest 22%
| 1,443 tons
Lowest 26%
|
|
Lake Shore Tower Apartments
5600 N SHERIDAN RD
| Multifamily Housing | 11.5 kg/sqft
Highest 22%
| 1,150 tons
Lowest 11%
|
|
60 E 36TH PL
60 E 36TH PL
| Multifamily Housing | 11.4 kg/sqft
Highest 22%
| 1,065 tons
Lowest 5%
|
|
The Thompson Building
350 N Clark St
| Office | 11.4 kg/sqft
Highest 22%
| 1,264 tons
Lowest 18%
|
Data Source:
Chicago Energy Benchmarking Data