Electrify Chicago
According to the
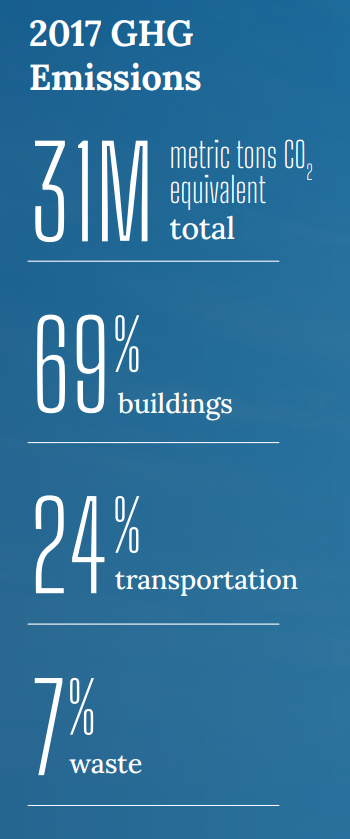
2022 Chicago Climate Action Plan ,
a whopping 69% of Chicago's emissions come from buildings, making it
our biggest challenge and our biggest opportunity as a city to tackle
change. At Electrify Chicago we want to showcase some of the best and worst performing
buildings in the city using publicly available data and manual annotations to add
building photographs and label multi-building owners like universities.
,
a whopping 69% of Chicago's emissions come from buildings, making it
our biggest challenge and our biggest opportunity as a city to tackle
change. At Electrify Chicago we want to showcase some of the best and worst performing
buildings in the city using publicly available data and manual annotations to add
building photographs and label multi-building owners like universities.
You can start by looking at Chicago's buildings with the highest greenhouse gas intensity - this means that they use the most energy when adjusted per unit of square foot, so big buildings could actually perform much better than very inefficient small buildings on this metric.
Chicago Buildings by Greenhouse Gas Intensity
Note: Data only includes large Chicago buildings from 2020
Note: This data only includes buildings whose emissions are reported
under the
Chicago Energy Benchmarking Ordinance. According to the City “As of 2016,
this list includes all commercial, institutional, and residential buildings larger than
50,000 square feet.” This dataset is also then filtered to only buildings with
reported emissions > 1,000 metric tons CO2 equivalent.
This data is also from 2020, but when new benchmark data is available, we'll update the site.
| Property Name / address | Primary Property Type |
Greenhouse Gas Intensity (kg CO2 eq./sqft) |
Total Greenhouse Emissions (metric tons CO2 eq.) |
|---|---|---|---|
|
WTTW 11 - Main Campus
5400 N St Louis Ave
| Office | 15.4 kg/sqft
Highest 13%
| 2,813 tons
Highest 33%
|
|
820 N Orleans St
820 N Orleans St
| Office | 15.4 kg/sqft
Highest 13%
| 2,388 tons
Highest 41%
|
|
2340 N California Ave
2340 N California Ave
| Multifamily Housing | 15.3 kg/sqft
Highest 13%
| 1,468 tons
Lowest 28%
|
|
22 W Washington St
22 W Washington St
| Office | 15.2 kg/sqft
Highest 13%
| 7,149 tons
Highest 10%
|
|
Mahalia Jackson Apt
9141 - 9177 S South Chicago Ave
| Multifamily Housing | 15.2 kg/sqft
Highest 13%
| 1,390 tons
Lowest 24%
|
|
Home Depot, #1950 Chicago South Loop
1300 S Clinton St
| Retail Store | 15.1 kg/sqft
Highest 13%
| 1,598 tons
Lowest 34%
|
|
Moody Bible Institute, Torrey-Gray Doane
840 N LaSalle St
| College/University | 15.1 kg/sqft
Highest 13%
| 1,306 tons
Lowest 20%
|
|
Walmart Supercenter #5965
10900 S Doty Ave
| Wholesale Club/Supercenter | 15.1 kg/sqft
Highest 13%
| 2,359 tons
Highest 42%
|
|
California Park / McFetridge
3843 N California Ave
| Other - Recreation | 15.1 kg/sqft
Highest 13%
| 1,630 tons
Lowest 35%
|
|
Aperion Care International
4815 S Western Blvd
| Senior Care Community | 15.0 kg/sqft
Highest 14%
| 1,372 tons
Lowest 23%
|
|
Symphony of Chicago West
5130 W JACKSON BLVD
| Senior Living Community | 15.0 kg/sqft
Highest 14%
| 1,659 tons
Lowest 36%
|
|
Kennedy-King College
6301 S Halsted Ave
| College/University | 15.0 kg/sqft
Highest 14%
| 7,464 tons
Highest 9%
|
|
S1-Sinai
🚩
1525 S CALIFORNIA AVE
| Hospital (General Medical & Surgical) | 15.0 kg/sqft
Highest 14%
| 15,145 tons #41 Highest
|
|
MB Ice Arena
1801 W Jackson Blvd
| Ice/Curling Rink | 14.9 kg/sqft
Highest 14%
| 1,900 tons
Lowest 45%
|
|
Ford City Mall - AMC Theater
7601 S Cicero Ave
| Movie Theater | 14.7 kg/sqft
Highest 14%
| 1,068 tons
Lowest 5%
|
Data Source:
Chicago Energy Benchmarking Data